What is a cosmic ray shower and how are cosmic rays similar to rain?
These are two very different but closely related questions:
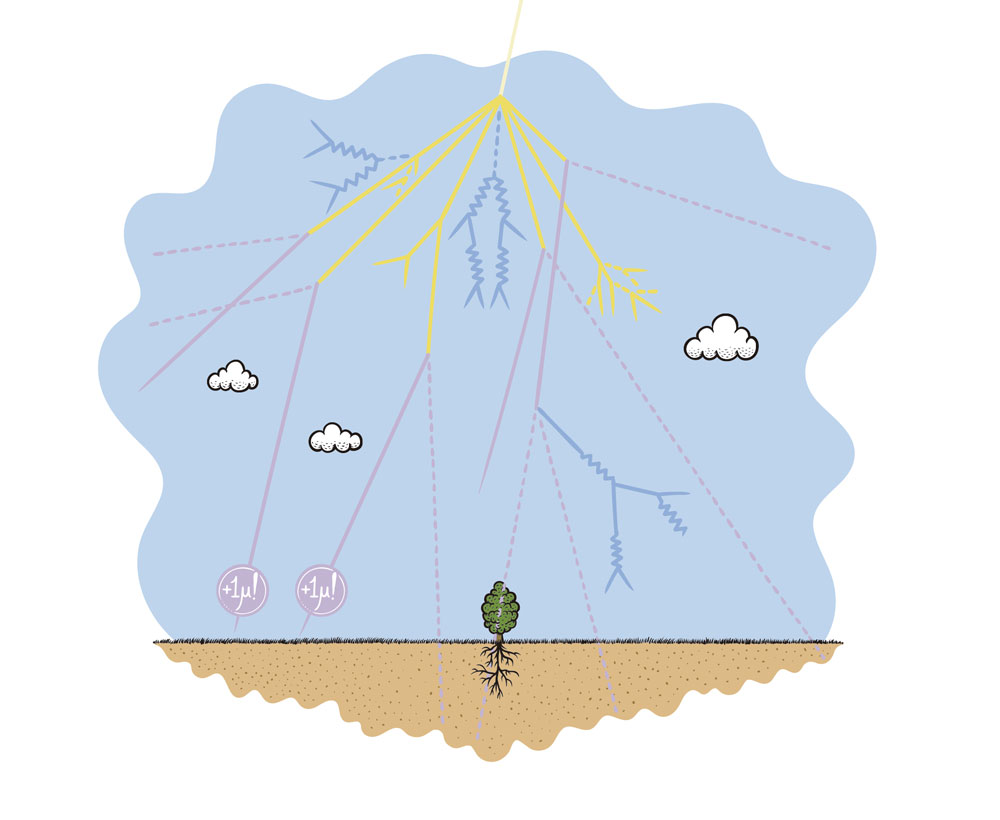
When a primary cosmic ray, for example a proton, stumbles upon the Earth, the first thing it encounters is the atmosphere. There, at an average height of about 15 km, a collision with an atomic nucleus takes place, from which very often a proton or a neutron and dozens of other high-energy subatomic particles, especially pions and kaons, are ejected, thus initiating an atmospheric shower. Much less frequently, the product can be other particles, even the heaviest ones, such as Higgs particles or top quarks (1).

Fig. 1 Secondary cosmic ray shower that develops when a primary cosmic ray particle collides with the nucleus of an atom in the upper atmosphere. Mostly neutrinos (ѵ, which penetrate the Earth's interior with great ease) and muons (μ) reach the surface. Image: Wearbeard
All these particles are unstable and decay with very short half-lives, so it is the descendants of these pions and kaons, which are mostly muons and neutrinos, that reach the surface.
These processes are called showers, and looking at Fig. 1 or a more realistic simulation like this one, https://youtu.be/vD_TPZmr18Mwe can easily imagine why.
However, there is another reason why the metaphor of cosmic rain falling on us is so popular. Let's start, for example, with this video by experimental particle physicist Pablo García Abia.
The water droplets arrive randomly not in the sense of where they fall, but in a more precise sense that we can test with the data from the detector of the exhibition.
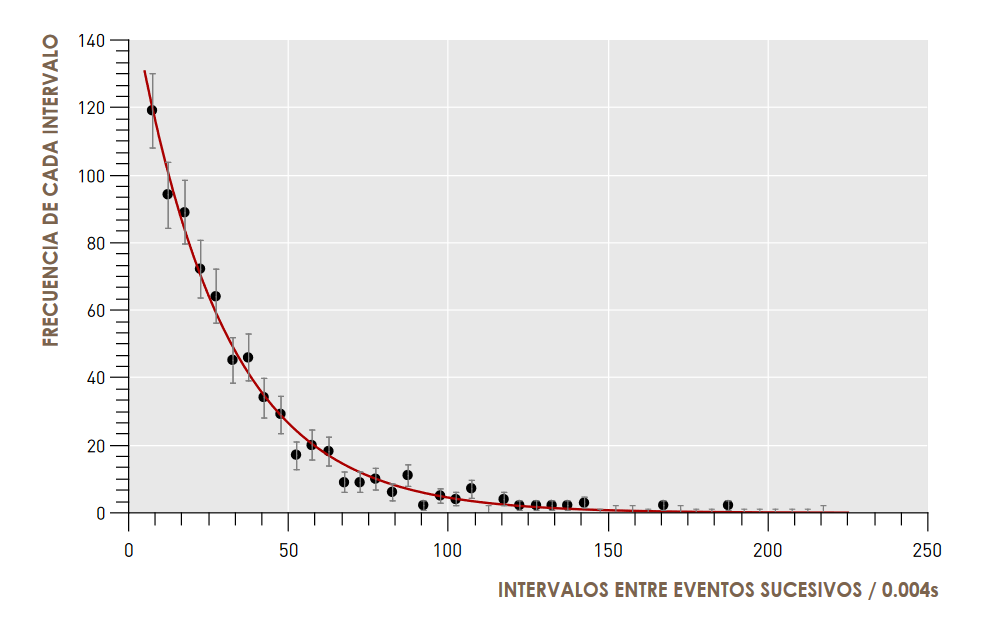
Whether we measure the time that elapses between the fall of one drop and the next, in a gentle and steady rain, or the arrival times of consecutive events at our detector, we will obtain the same result: there is a perfectly defined mean time between drop and drop, or particle and particle, but the time at which the next drop will fall is unpredictable, random.
Such a process is said to be a Poisson process (2) and if we plot the frequency of the different waiting times between one event and the next in a histogram we see a very clear sign of order within the randomness, the exponential distribution.

Fig. 2 Distribution of the time intervals between two successive cosmic rays recorded by a detector. An exponential curve is shown to which the experimental data are fitted, and which are shown with vertical ("error") bars indicating the uncertainty in the measurement.
We are grateful to Mihály Vadai for introducing us in 2015 at CERN's High School Teachers programme to a detector that inspired the one in the MUNCYT exhibition (3) and in 2017 to the Hungarian students of the HSSIP programme for the idea of comparing the "fall" of muons with that of raindrops (4).
(1) More information about elementary particles at https://particleadventure.org/ or, only in Spanish, in the Experimenta booklet “Cosmic rays”: http://www.muncyt.es/stfls/MUNCYT/Publicaciones/rayos_cosmicos_muncyt.pdf
(2) See, for example The Poisson Distribution and Poisson Process Explained. A straightforward walk-through of a useful statistical concept, by Will Koehrsen at https://towardsdatascience.com/the-poisson-distribution-and-poisson-process-explained-4e2cb17d459.
(3) https://indico.cern.ch/event/355973/timetable/#106-report-from-work-group-1-c
(4) https://indico.cern.ch/event/891526/contributions/3759869/

