
What can I do with the data? Examples of analysis
This is not the place to set out in detail what interested members of the public can do with the data, but it is worth mentioning the most immediate and prominent possibilities. Always bear in mind the caveat in the previous question that not all data are directly comparable - see the previous question.
This is a provisional presentation while more data is being collected, so for example the graphs are only intended to be qualitative, without scale, error bars or careful labelling.
1. Study of the time variation of the cosmic ray flux
Looking for daily or seasonal modulations, etc. Data does not really give the flux - a quantity independent of the detector geometry - but the number of coincidences per unit time, but for simplicity we will use this term. Moreover, we will make the approximation of considering that all coincidences are due to cosmic rays, which is not guaranteed, as accidental coincidences cannot be avoided.
2. Correlation of flux with atmospheric pressure
If surface atmospheric pressure data are recorded in parallel, one can study, as Arturo Duperier did, the correlation with the cosmic ray flux. This was one of the paths that led to his most important work.
3. Time separation between consecutive events
Cosmic ray events occur randomly - they "fall like raindrops" - so it is very interesting and surprising for many people that they have a mathematically well-defined distribution, shown in the following histogram obtained from the first ten thousand detector data:
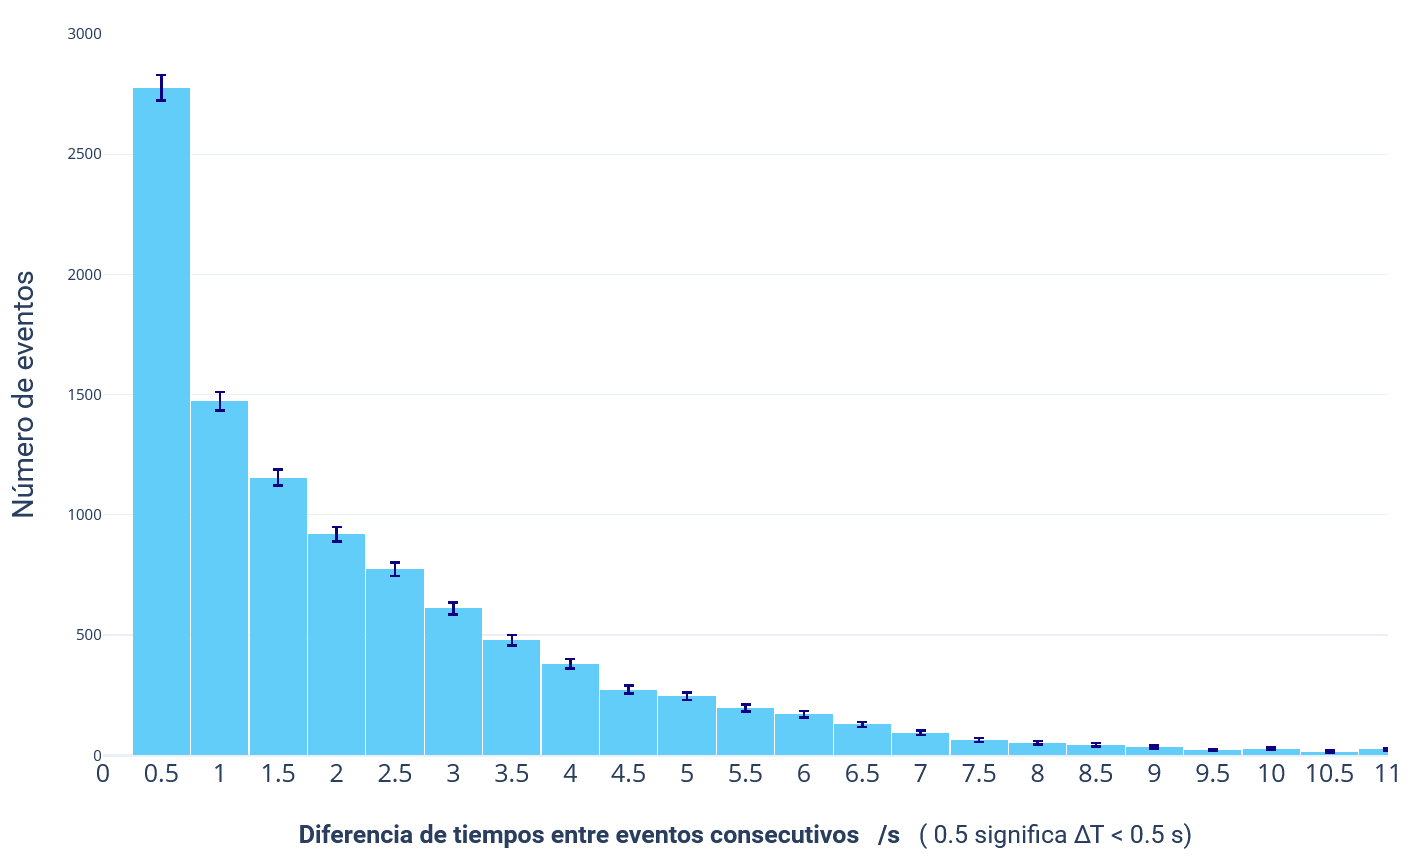
Fig. C3-1: Distribution of time differences between consecutive coincidences. Courtesy of Gustavo Martínez Botella
From these data, students can be led to consider the influence of the measuring device on measurements, showing that scientific instruments are not nearly as transparent as they are usually presented in the school environment. For example, you can “see” in the data the dead time of the detector, i.e. the time from when it registers one event until it is ready to register the next one?
4. Angular dependence of the cosmic ray flux
Given the geometry of the detector - two parallel trays with 8 tubes each and horizontal and vertical spacings of 15.6 mm between adjacent tubes - there are 64 possible coincidences between pairs of tubes, one from each tray, which define the following cosmic ray incidence angles with respect to the zenith (0°):
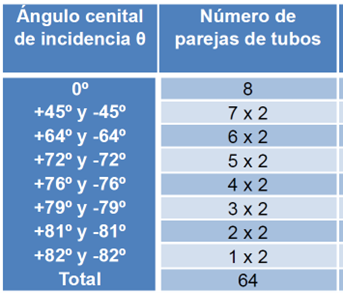
Fig. C3-2. Angles of incidence according to the pair of tubes to be activated. Courtesy Gustavo Martínez Botella
To these should be added the coincidences with angle ±90º (horizontal), defined between all the tubes of one of the two trays.
With this, the distribution of coincidences as a function of the zenith angle can be studied. Binning the angles together leads to data such as these:
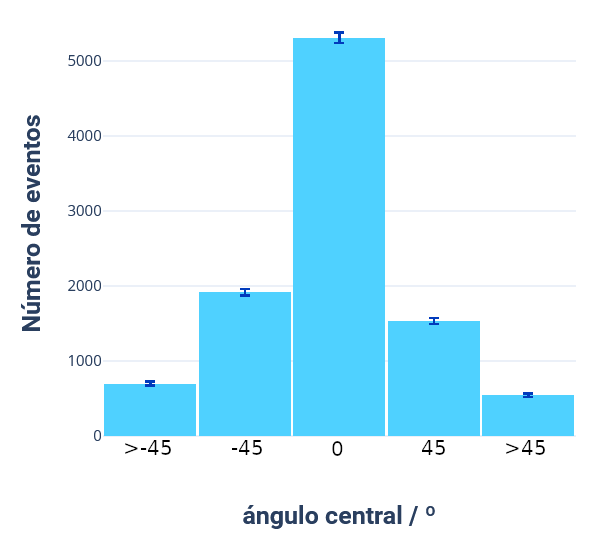
Figura C3-3: Qualitative distribution of angles of arrival of cosmic rays with respect to the zenith. Courtesy of Gustavo Martínez Botella.
This is undoubtedly one of the most interesting results to discuss with students, and it also has an instrumental side that is very often ignored in the teaching of physics - and not only at pre-university level! Without going into details, let us recall that primary cosmic rays reach the Earth in a very isotropic way - i.e. from all directions equally, see question a3 - how is it possible that most of the ones we detect come "from above"?
One might think that this is due to the different acceptance of the vertical and inclined channels. But even if we take this factor into account by geometrical calculations or a simulation, the qualitative distribution does not change: there are many more muons coming from the zenith than from other angles, and almost none from the horizon.
To find out why, note that muons (1) are unstable particles that live on average on the order of 2 microseconds and that the vertical ones pass through an atmosphere thickness of about 15 km while the horizontal ones travel about 30 times longer, about 450 km. The details are in question A7.
Now it's your turn: how could you complete or modify these analyses or include others?
(1) Estamos tomando la parte por el todo: es sólo una aproximación sustituir los rayos cósmicos por sus componentes mayoritarios, los muones…